Why Every Website Should Leverage Infographics

Website content must be not only informative but also engaging. Enter infographics—a potent tool for web designers, content creators, and marketers looking to communicate complex data and concepts in a digestible, visually appealing way. Infographics are much more than trendy graphics; they’re strategic assets for websites that aim to enhance user experience, boost engagement, and effectively convey key messages.
Why Use Infographics?
Infographics combine data visualisation with compelling storytelling. When you present information in a graphic format, users are more likely to engage with, understand, and remember the content. Here are some of the key reasons to consider using infographics on your website:
1. Enhanced User Engagement
Infographics are inherently eye-catching, especially when designed with high-quality visuals and colours. They help break up large blocks of text, which can deter readers. By providing a visual experience, infographics encourage users to stay on your page longer, reducing bounce rates and increasing the chance of conversions.
2. Improved Information Retention
Users are more likely to remember information that’s presented visually. An effective infographic boils down complex concepts into simplified visuals, making it easier for audiences to grasp and retain key points. This is invaluable when trying to explain industry-specific data or intricate processes that would otherwise overwhelm users.
3. SEO Benefits
Optimised infographics can improve your SEO in two ways: by attracting more backlinks and keeping users on your site longer. When an infographic resonates with viewers, they’re more likely to share it, increasing the chances of organic backlinks. Furthermore, since infographics reduce bounce rates by engaging users, search engines view your content as more valuable and are more likely to rank it higher.
4. Increased Shareability
Infographics have an innate "shareability" factor. Their visual appeal makes them ideal for social media sharing, which can increase your brand's reach. Websites with sharable infographics have a higher chance of going viral, especially if the infographic tackles a trending topic or provides unique insights.
Types of Infographics to Consider
Not all infographics are created equal, and choosing the right format for you can amplify your message. Here are some popular types:
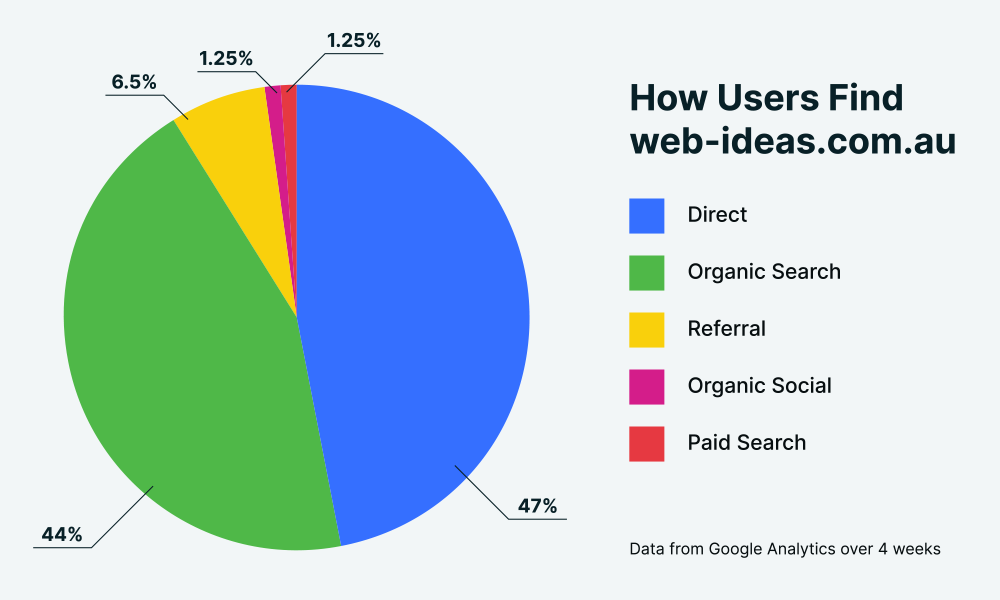
Statistical Infographics
Great for highlighting data and numerical insights. They often incorporate charts, graphs, and tables to provide a clear view of data-driven stories.
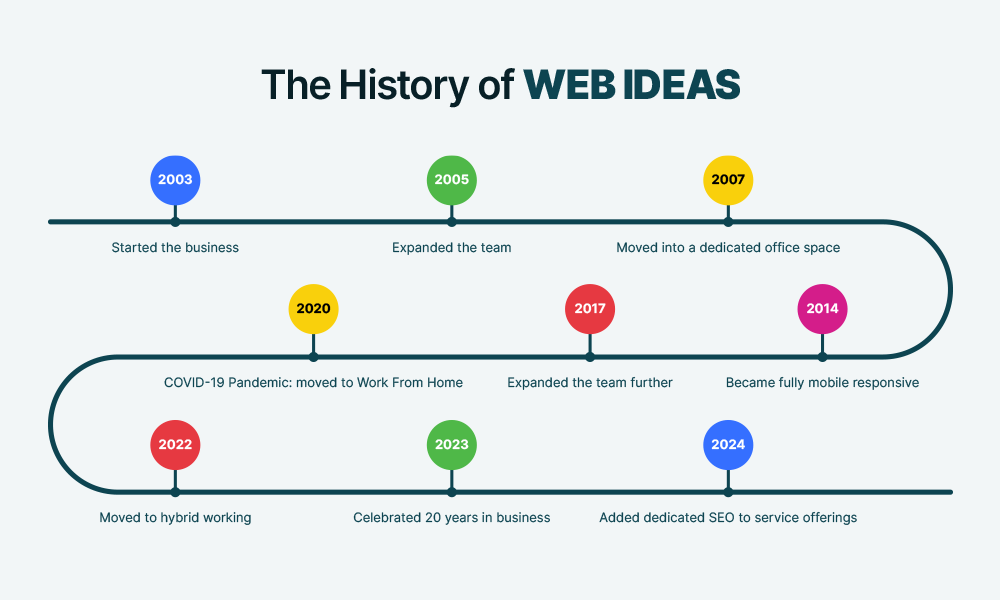
Timeline Infographics
Perfect for presenting historical or step-by-step information. They’re especially effective when you need to show the evolution of a concept, product, or company.
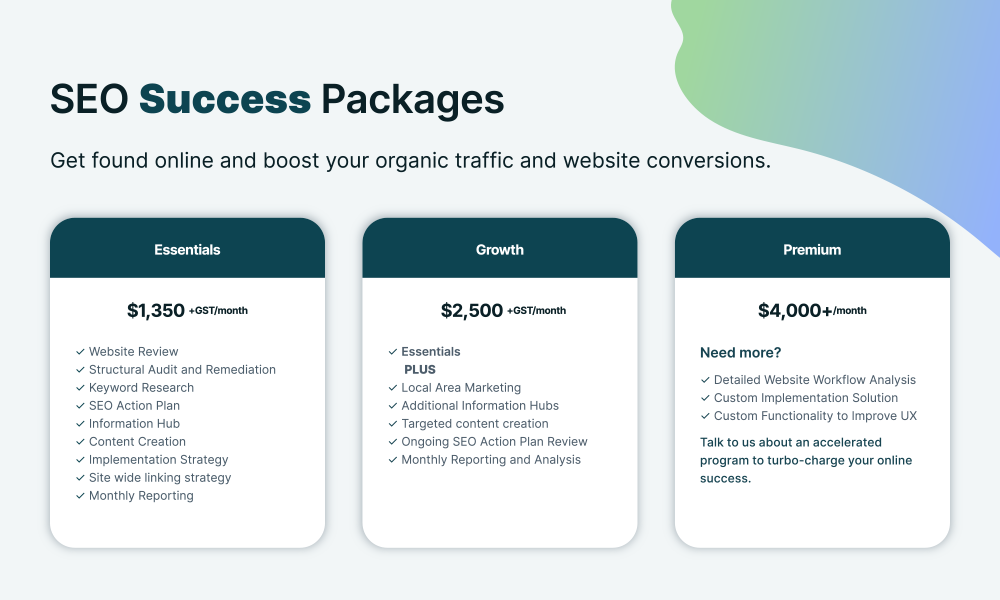
Comparison Infographics
Useful for showcasing the differences or similarities between two or more items, like products, services, or approaches. They make it easy for readers to make informed decisions.
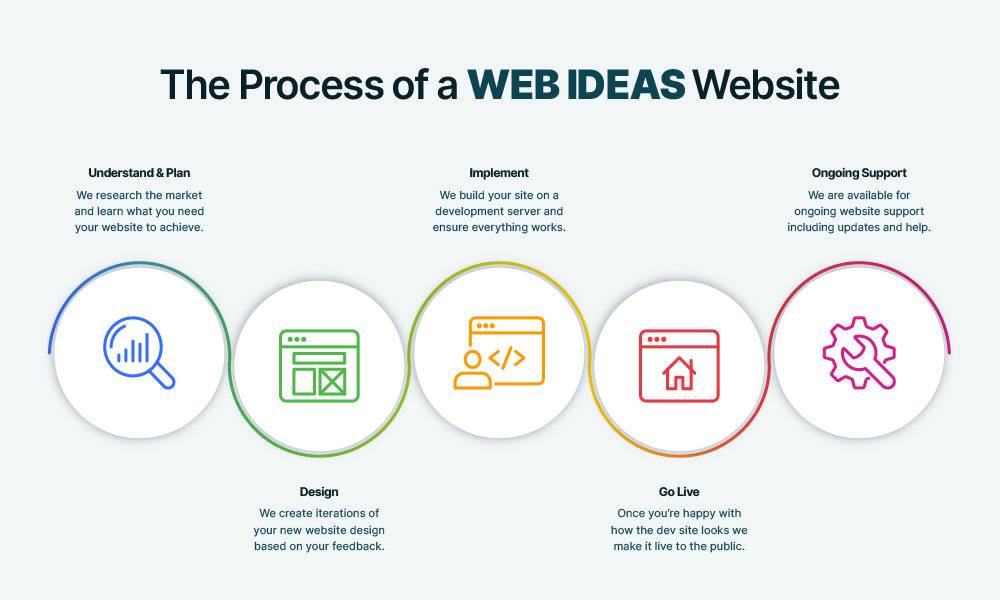
Process Infographics
These illustrate a process, workflow, or sequence, making them ideal for tutorials or guides. They’re commonly used on websites with a strong educational focus.
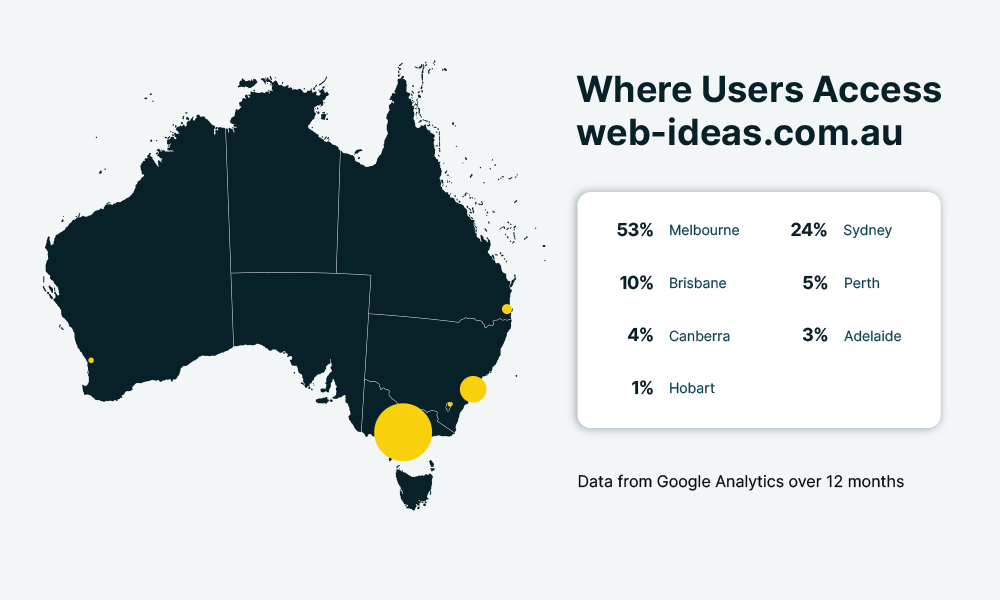
Geographical Infographics
These use maps to show data related to specific locations, such as demographics or market trends, which can help contextualise information for a region.
Best Practices for Using Infographics on Websites
Now that we know the value and types of infographics, let’s talk about how to implement them on your website effectively:
1. Prioritise Clarity Over Design
The primary goal of an infographic is to convey information quickly and clearly. Avoid overcrowding the design with excessive colours, fonts, or icons that may distract from the main message. Use a clean, consistent design style that aligns with your brand.
2. Optimise for SEO
Include alt tags, meta descriptions, and appropriate keywords for your infographic images. This helps search engines understand the content and increases the chances of your infographics appearing in image search results. Also, compress images to avoid slow page loads, as speed is crucial for user retention and SEO.
3. Consider Accessibility
To ensure that infographics are accessible to all users, including those with visual impairments, provide descriptive alt text and a text version of the content. This makes your infographics compatible with screen readers and aligns your site with accessibility standards.
A Real-World Example of Successful Infographic Use
Many brands have successfully harnessed the power of infographics to communicate with their audience. For instance, HubSpot regularly uses infographics to simplify complex marketing concepts. This shows how infographics can enhance a website’s value by making information accessible and engaging.
*****
Using infographics on your website is an investment in visual storytelling that can yield measurable returns. Whether you're a small business looking to explain your services, a blogger aiming to increase shares, or an enterprise seeking a professional edge, infographics can support your goals by creating an engaging, memorable experience for your audience. By strategically implementing them, you’ll be better equipped to capture attention, increase engagement, and stand out in an increasingly competitive digital landscape.
So, next time you’re crafting content, think about how an infographic could transform your data into a story your audience won’t forget.


